1 Series, seasonality, mean and dispersion
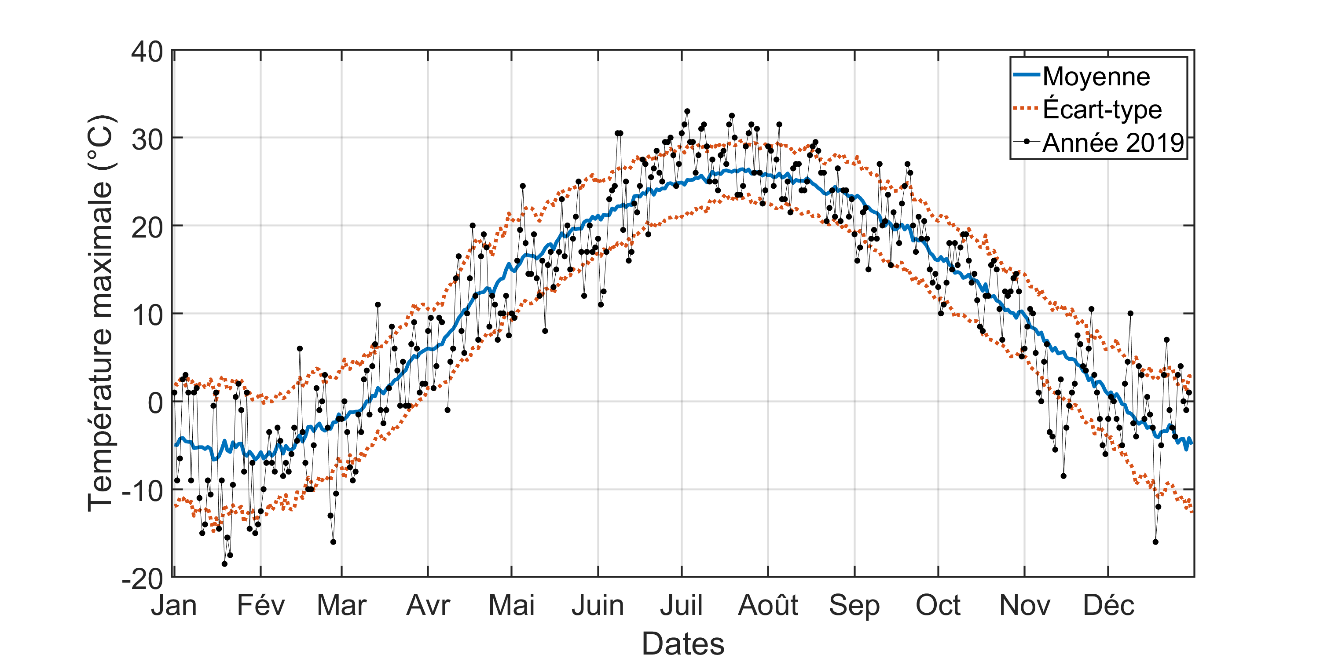
The values observed or simulated by a model, such as flow rates, temperatures and rainfall, are generally represented in the form of a time series. Figure 1.1 shows the example of a series of daily maximum temperatures recorded in 2019 at the Les Cèdres1 weather station, located near Montréal. Temperatures, like many other weather variables, exhibit significant variability and are often seasonal, as shown in the figure.
These temperatures can be compared to historical temperatures using various statistical indicators. The first of these indicators is the mean, which defines an expected value around which the series fluctuates. In Figure 1.1, the mean daily maximum temperature is estimated by averaging the daily values of the 108 years of the station’s operation (1913-2019). It is represented by the blue line in Figure 1.1.
The second indicator measures the values’ dispersion around the mean. There are several ways to quantify this, the best known being the standard deviation, which is represented by the two dotted lines in the figure. Thus, 71% of the daily maximum temperatures observed in 2019 are within one standard deviation of the mean (i.e. between the two dotted lines in Figure 1.1). It can also be seen that the daily maximum temperatures on certain days are sometimes much higher or lower than the mean. This is the case for several days in early July, when temperatures went above 30°C, and in January, when daily maximum temperatures were close to -20°C. These values deviate from the mean by more than one standard deviation.
The Les Cèdres station (7014290) is operated by Quebec’s Ministère de l’Environnement, de la Lutte contre les changements climatiques, de la Faune et des Parcs (MELCCFP).↩︎