4 Detecting trends in series of extremes
Climate change is manifested in a modification of the statistical characteristics of a series, generally a progressive increase or decrease in the mean and/or the dispersion (see Fact Sheet 3). However, extreme values are, by definition, associated with rare events; the more extreme they are, the rarer. That makes it difficult to detect a trend, meaning an increase or decrease in the frequency or amplitude of such events (see Fact Sheet 6 on trend tests). However, it’s essential to estimate long-term trends in extreme values, given the impacts of this type of event.
Two factors make it hard to identify trends in series of extremes, such as extreme rainfall. The first is the tremendous variability of this type of series. The annual maximum precipitation at the Chelsea station, shown in Fact Sheet 2, is a good example of this. The second factor is that we need long series in order to be able to discern the signal associated with climate change from the natural variability of the series. The series available in Quebec and Canada are relatively short and the trends are difficult to detect.
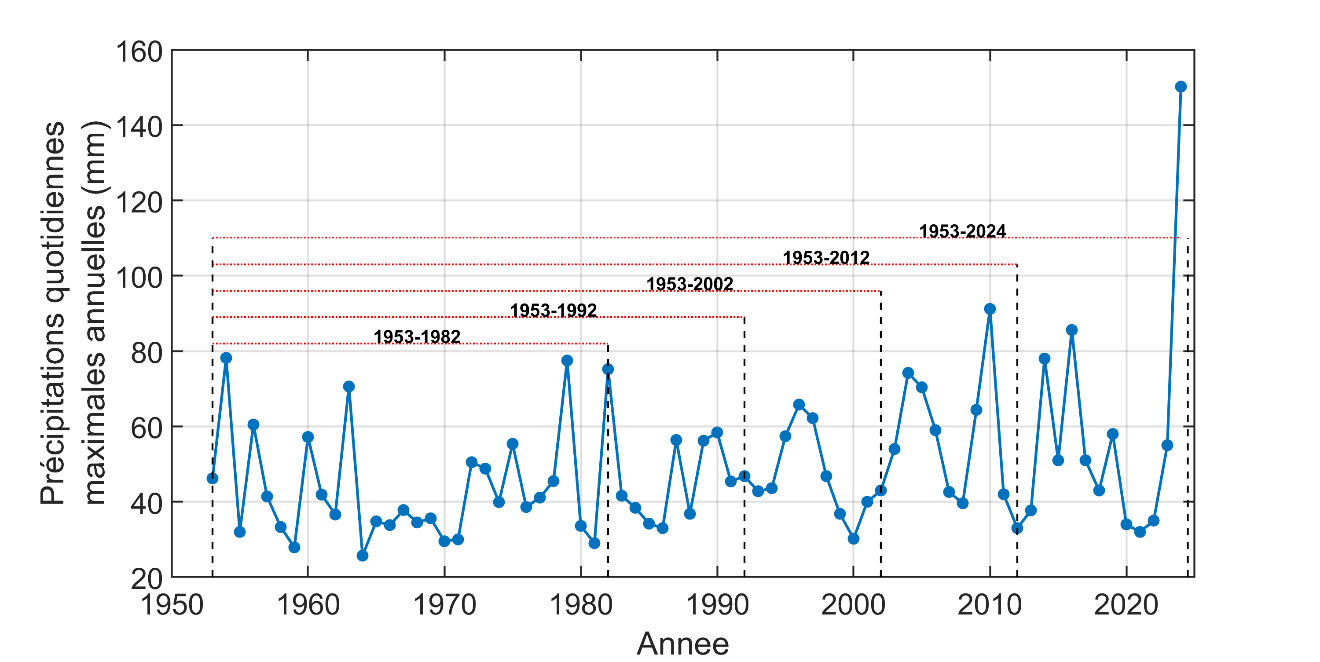
To illustrate this point, consider the annual maximum rainfall at the Oka station1, shown in Figure 4.1. If we consider the first 30 years, no trend is seen, which is confirmed by the application of a trend test (p-value of 0.915 for the Mann-Kendall test; see Fact Sheet A.6). A trend emerges as more data is added and longer historical periods are considered (Table 4.1).
The Mann-Kendall test shows that the hypothesis of the absence of a trend can be rejected at a 95% confidence interval when the series cover the 60-year period from 1953 to 2012 and the 72-year period from 1953 to 2024. Thus, although we have a remarkably long series, it takes 60 years or more to be able to discern a trend. No significant trend is detected when the series covers the period from 1953 to 2002. This result also shows that one must be very cautious when trends are detected in short series, since they could have been generated randomly and may not be real trends.
There are several other elements to consider when analyzing trends and interpreting the results. For variables that are subject to seasonal effects or cyclical phenomena (such as El Niño), it’s important to consider series covering several cycles. Otherwise, the detected trend will be artificial. Changes in instrumentation, sites, observation protocols, and surrounding conditions (e.g. tree growth near a weather station or, for flow rates, changes in land use in the upstream parts of a watershed) can also cause interruptions or give rise to trends that are not attributable to climate change.
| Period | p-value of the Mann-Kendall test | Significant trend (5% threshold) | Rate of change (% per decade) |
|---|---|---|---|
| 1953-1982 | 0.915 | No | - |
| 1953-1992 | 0.449 | No | - |
| 1953-2002 | 0.222 | No | - |
| 1953-2012 | 0.034 | Increase | 4.6 |
| 1953-2024 | 0.020 | Increase | 3.7 |
The Oka station (7015730) is operated by Quebec’s Ministère de l’Environnement, de la Lutte contre les changements climatiques, de la Faune et des Parcs (MELCCFP).↩︎