8 The peaks-over-threshold (POT) approach
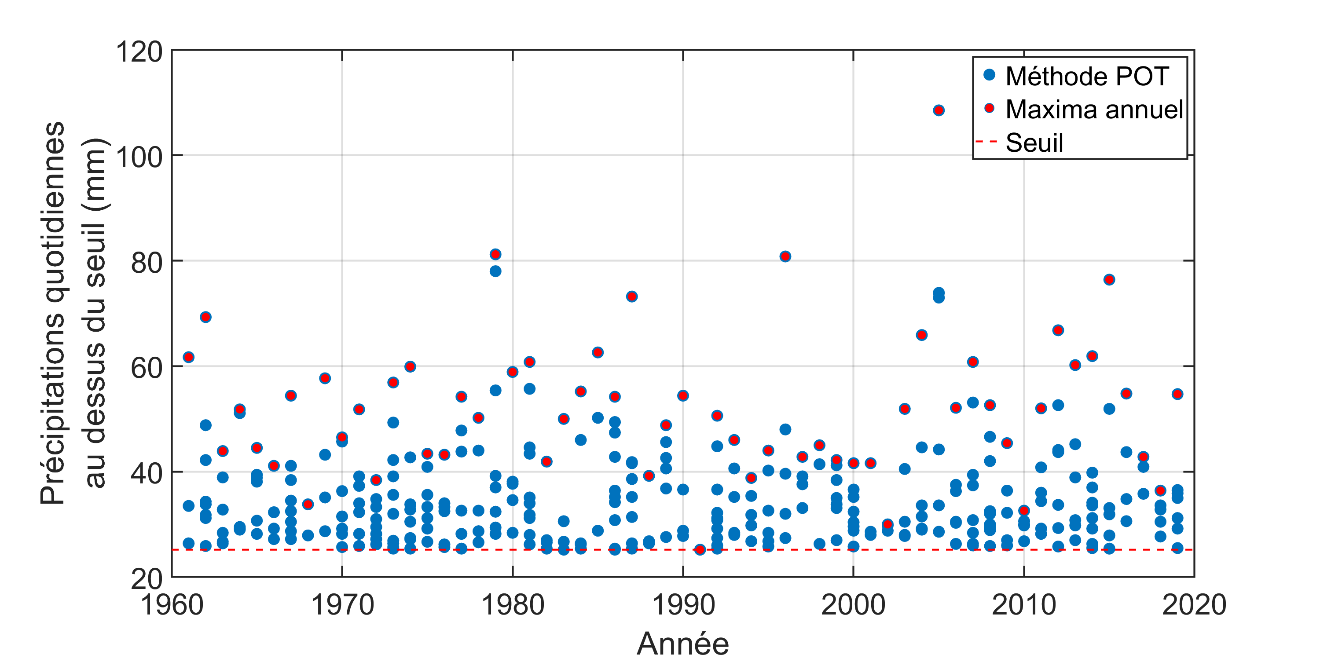
The series of annual maxima only include the highest value recorded each year. For example, consider the series of annual daily precipitation maxima at the Jean-Lesage Airport1 station in Québec City, shown in Figure 7.1. Since only one value is taken for each year, it is possible that daily precipitations between the largest and smallest annual maxima of the series were observed in certain years, but were not included for analysis purposes. If we extract these values, we obtain the series in Figure 8.1. It can be seen that several relatively major rainfall events are not included when only the annual maximum values are used, such as in 2005 (the year when the highest value was recorded).
The peaks-over-threshold (Coles 2001; Mailhot et al. 2013) (POT) approach allows these values to be integrated into analyses. It consists of defining a threshold and taking all the values above that threshold. The series of values above the threshold is called the partial duration series. The generalized Pareto distribution2 is then fitted to this data and used to estimate different extreme quantiles.
Identifying the threshold is tricky and is probably the main difficulty of the POT method. Several approaches have been proposed for setting the threshold, but the threshold remains arbitrary to some extent and its choice influences the results (for a discussion of this point, see Coles (2001)). Although the use of the POT method can, in principle, improve the inference of extreme quantiles, its implementation in practice requires some expertise.
Implementing the POT approach also requires having historical data archives with short time steps (e.g. 5-minute or hourly series) in order to be able to extract values above given thresholds. Only annual maximum rainfall of various durations is available in the historical data archives in Canada, making it impossible to extract values above a given threshold. For that reason, the POT approach cannot be used to build Intensity-Duration-Frequency (IDF) curves. The use of the POT method could prove advantageous in cases where continuous rainfall series are available.